20 分钟
可观测性(二)Metrics & Prometheus
概述
Metrics (指标) 是反应系统状态的具有明确定义的数值。比如一个 Web 服务的响应时间,请求量,数据库连接数等等。Metrics 是由一系列带有属性的随着时间变化的数值分组/聚合得来的,一般可以绘制成关于时间的图表。
因此 Metrics 是系统具有良好的可观测性的关键,基于 Metrics 可以制作:
- 定义系统异常报警规则。
- 系统监控仪表盘 (数据看板)。
基于以上手段,可以系统开发和运维人员提供系统内部情况,以:
- 保证系统稳定运行。
- 更好的发现系统可优化项。
- 量化系统优化效果。
提供 Metrics 的数据收集、数据存储、数据查询的系统一般称为系统监控系统平台。
Prometheus 就是目前最主流的开源的监控平台。是 CNCF 继 Kubenates 之后的第二个托管项目。
架构
图片来源:Prometheus 官网)
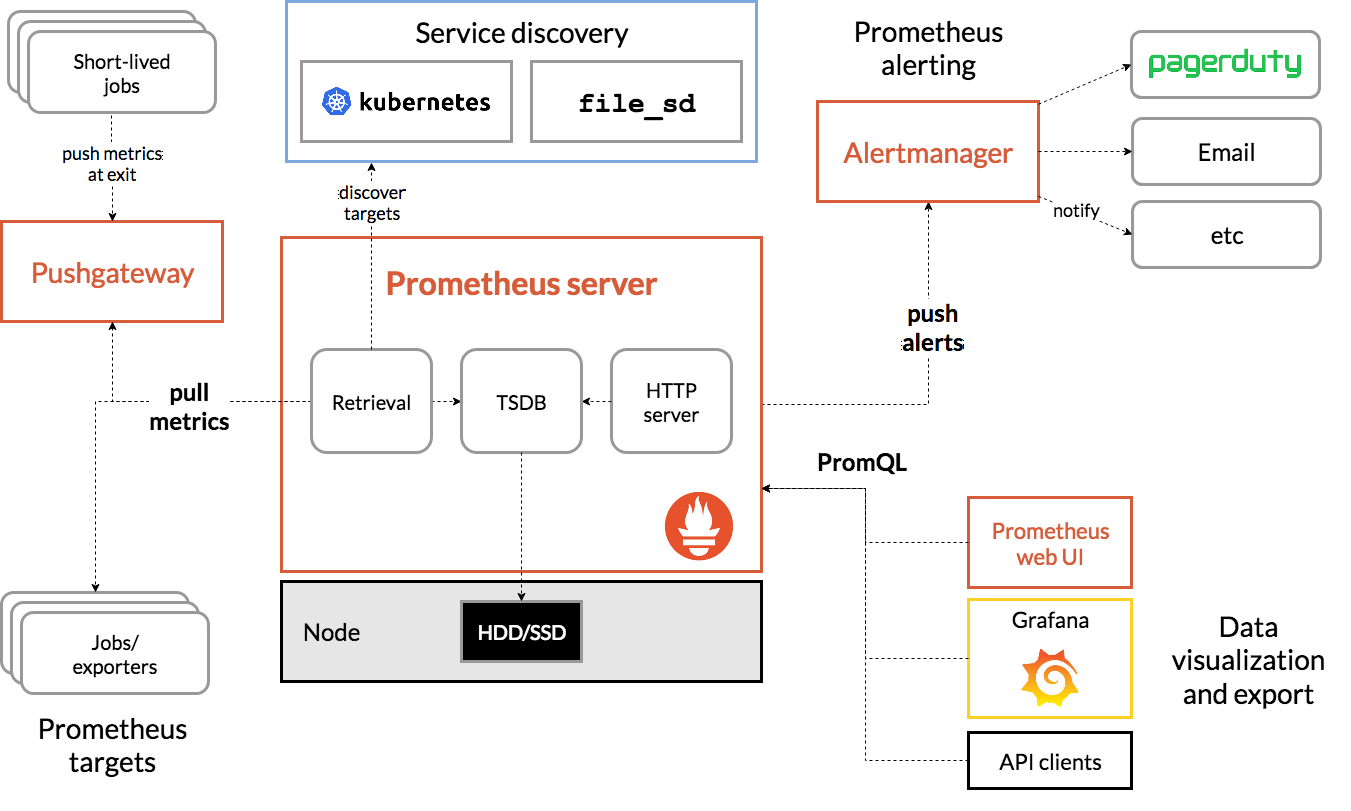
Prometheus 由如下组件组成:
- Prometheus server 系统核心,提供数据收集、数据存储、数据查询能力,主要由如下部分组成:
- Retrieval 定时从被监控的应用程序拉取 (pull) 指标数据。
- TSDB 时序数据库,存储指标数据。
- HTTP Server 提供配置、数据查询能力。
- client libraries 嵌入到被监控的应用程序,会启动一个符合 Prometheus 规范的 http 端点来暴露指标, Retrieval 会定时从该端点拉取指标数据。
- push gateway 某些场景,被监控应用程序很短的,或者无法暴露端口,此时可以 push gateway 通过推送 (push) 的方式主动发送指标数据。该 push gateway 会暴露一个服符合 Prometheus 规范的 http 端点,让 Retrieval 来拉取 (pull) 应用程序的指标数据。
- exporters 用来监控某个类应用程序的服务,这些服务,会通过 client libraries 暴露这些应用程序的内部指标。
- alertmanager 报警管理器,用来对接各种报警系统,Prometheus server 会推送报警数据 (push) 到 alertmanager,alertmanager 在调用各种报警系统。
快速开始
下载运行 Prometheus
Prometheus 是由 Go 语言编写,因此只需下载一个静态编译的可执行文件即一键启动。
前往下载页,下载 prometheus 软件包。
tar xvfz prometheus-*.tar.gz
cd prometheus-*/
./prometheus --help  # Mac 需要打开系统偏好设置 -> 安全性和隐私,允许改程序运行。
配置 Prometheus
在软件包中,包含一个简单配置文件 ./prometheus.yml,重要内容如下:
# 全局配置
global:
  scrape_interval: 15s # 抓取数据的间隔时间,默认为 1 分钟。
  evaluation_interval: 15s # 每 15 秒重新加载并检查一次规则,参见 rule_files。 默认值为 1 分钟。
  # scrape_timeout: # 抓取数据的超时时间,默认为 10 秒.

# 报警配置
alerting:
  alertmanagers:
    - static_configs:
        - targets:
          # - alertmanager:9093

# 规则配置文件,检查更新时间通过 global.evaluation_interval 配置
rule_files:
  # - "first_rules.yml"
  # - "second_rules.yml"

# 数据抓取配置,该配置包含一个去抓取的端点:
# 这里是抓取 Prometheus 程序自身。
scrape_configs:
  # job_name 字段会作为 `job=<job_name>` 附加到抓取到数据的 labels 中。
  - job_name: "prometheus"

    # metrics_path: # 默认是 '/metrics'
    # scheme: # 默认是 'http'.

    static_configs:
- targets: ["localhost:9090"]配置文件的说明,参见:官方文档。
启动 Prometheus
./prometheus --config.file=prometheus.yml- 通过
http://localhost:9090可以访问 Prometheus 的 WebUI。 - 通过
http://localhost:9090/metrics可以获取到 Prometheus 自己暴露的指标。
使用 Prometheus 表达式 (PromQL) 查询
- 打开
http://localhost:9090/graph。 - 输入
promhttp_metric_handler_requests_total(这个指标数据类型为counter计数器,数据类型参见下文),可以获取到当前时刻,该指标在每种 labels 下的计数。 - 输入
promhttp_metric_handler_requests_total{code="200"},可以获取到当前时刻,该指标满足 labelcode="200"情况的计数。 - 输入
count(promhttp_metric_handler_requests_total),可以获取到当前指标在所有 labels 组合的情况下的指标数。 - 输入
rate(promhttp_metric_handler_requests_total{code="200"}[1m])(在选中时间范围内,t 时刻的 counter 减去 1 分钟之前 counter 的差除以 60s 值) 可以查看计数器的变化率。 - 关于 Prometheus 表达式语法,参见下文或官方文档。
数据模型
Prometheus 的 metrics 在存储上,本质上是时间序列(时序数据)。每个时间序列都有一个唯一的 name 作为唯一标识符以及可选的被称为 labels 的键值对,以及样本值和样本时间采样时间戳。
- metric name 格式必须满足
[a-zA-Z_:][a-zA-Z0-9_:]*正则表达式(冒号最好不要使用),如http_requests_total。 - metric label 用来标识改时序数据的维度。PromQL 可以基于这些维度进行过滤和聚合,更改任何 label 的值,包括添加或删除 label,都会创建一个新的时间序列。
- label name 必须满足
[a-zA-Z_][a-zA-Z0-9_]*正则表达式。以__开头的标签名称保留供内部使用。 - label value 是个 Unicode 字符串。
- 跪安与 label 的最佳实践,参见:best practices for naming metrics and labels。
- label name 必须满足
- metric sample (样本) 即上到的采样数值,每个样本包含:
- value 类型为 float64(v2.40 起 value 可以是直方图数据,参见下文)。
- timestamp 毫秒精度的时间戳。
- 一个给定 name 和 labels 的时间序列经常使用如下符号表示:
<metric name>{<label name>=<label value>, ...},比如api_http_requests_total{method="POST", handler="/messages"}。
Prometheus 目前支持如下四种数据类型。
Counter (计数器)
Counter 代表一个单调递增的计数器,其值只能递增,或者在重新启动时重置为零。一般用于如下计算某个值的变化率。例如,您可以使用计数器来表示服务的请求数、完成的任务数或错误数。
也就是说,应用程序想要上报一个 Counter 类型的指标时,只有一个 Add 函数。
注意,一般不用 Counter 表示某总量的值,因为 Counter 在服务重启后会清零。
举个例子,想监控某后端系统的 QPS 时,上报一个类型为 Counter 的 Metric。
- Name 为
http_requests_total。 - Labels 为:
code:返回的状态码。method:http 请求的方法。handler:请求的路径。
假设采样周期为 1 分钟,且有两个接口分别:
GET /handler1可能返回200、500。POST /handler2可能返回200、400。
在程序启动后:
- 第一分钟
GET /handler1返回 200,的数量为 100GET /handler1返回 500,的数量为 10POST /handler2返回 200,的数量为 50POST /handler2返回 400,的数量为 5
- 第二分钟
GET /handler1返回 200,的数量为 200GET /handler1返回 500,的数量为 5POST /handler2返回 200,的数量为 100POST /handler2返回 400,的数量为 30
此时,
第一分钟末,Prometheus 获取到的数据为:
http_requests_total{method=GET, handler=/handler1, code=200} 100
http_requests_total{method=GET, handler=/handler1, code=500} 10
http_requests_total{method=POST, handler=/handler2, code=200} 50
http_requests_total{method=POST, handler=/handler2, code=400} 5
第二分钟末,Prometheus 获取到的数据为:
http_requests_total{method=GET, handler=/handler1, code=200} 300
http_requests_total{method=GET, handler=/handler1, code=500} 15
http_requests_total{method=POST, handler=/handler2, code=200} 150
http_requests_total{method=POST, handler=/handler2, code=400} 35
此时在计算 QPS 时,可以通过两个时间的 counter 的差值除以总时间,而得到 QPS(对应函数为
rate)。
Gauge (仪表盘)
Gauge 代表一个可任意变化的值,这个值可增可减。该类型可以用来表示某时刻的总数。比如数据库连接数量、内存使用量等。
也就是说,应用程序想要上报一个 Gauge 类型的指标时,可以通过 Set 函数设置成任意值。
Histogram (直方图)
v2.40 新增
Histogram 统计的时某个值(通常是请求持续时间或响应大小等)所在的区间(被称为存储桶 Bucket)的数量。
举个例子,比如一个名为 http_requests_time 的 Histogram,用来统计请求耗时的分布情况。
配置了 6 个 Bucket:
- 桶
< 0.2秒 - 桶
< 0.4秒 - 桶
< 0.6秒 - 桶
< 0.8秒, - 桶
< 1秒, - 桶
< 无穷大秒。
在程序启动的一分钟内:
- 请求耗时
< 0.2秒的,有 7 次请求耗时分别为: 0.02, 0.1, 0.15, 0.15, 0.16, 0.17, 0.18 。 - 请求耗时
< 0.4且>= 0.2秒的,有 2 次请求耗时分别为: 0.3, 0.35 。 - 请求耗时
< 0.6且>= 0.4秒的,有 1 次请求耗时分别为: 0.5 。 - 请求耗时
< 0.8且>= 0.6秒的,没有符合要求的请求。 - 请求耗时
< 1且>= 0.8秒的,没有符合要求的请求。 - 请求耗时
< 无穷大且>= 1秒的,没有符合要求的请求。
通过 Observe() 函数,此时 Histogram 会产生如下几个时序数据。
<basename>_bucket{le="<upper inclusive bound>"}每个 Bucket 的计数。http_requests_time_bucket{le="0.2"} 7http_requests_time_bucket{le="0.4"} 9可以看出,统计的时<0.4的所以包含<0.2的数目,下面同理。http_requests_time_bucket{le="0.6"} 10http_requests_time_bucket{le="0.8"} 10http_requests_time_bucket{le="1.0"} 10http_requests_time_bucket{le="+Inf"} 10
<basename>_sum值的总和。http_requests_time_sum 2.08(计算方法为0.02 + 0.1 + 0.15 + 0.15 + 0.16 + 0.17 + 0.18 + 0.3 + 0.35 + 0.5)
<basename>_count等价于<basename>_bucket{le="+Inf"}http_requests_time_count 10
在程序运行的第二分钟后,这里的所有指标,都是基于之前第一分钟之后的数据进行累加的(和 Counter 有点类似)。
基于如上,可以计算出:
- 请求 QPS:
rate(<basename>_count),即在第一分钟为:10/60次每秒。 - 平均耗时:
rate(<basename>_sum[1m]) / rate(<basename>_count[1m]),即在第一分钟为:2.08 / 10 = 0.208 - 分位数:假设我们想计算 90% 的分位数,算法如下(参考:一文搞懂 Prometheus 的直方图):
- 按照 le 标签排序,查找第一个满足
>= 90% * <basename>_count的 le(本例中为>= 0.9 * 10 = 9即 le 为 0.4),并记:- bucketStart = 这个 le 标签的值,即 0.4
- bucketEnd = 下一个 le 标签的值,即 0.6
- bucketStartCount = 上一个 le 的数量,即 7
- bucketEndCount = 上一个 le 的数量,即 9
- count = bucketEndCount - bucketStartCount ,即
9-7 = 2, - rank = 90% 在 count 中的序号,即
90% * <basename>_count + 1 - bucketStartCount,即9-7=2
- 最终,公式为:
bucketStart + (bucketEnd-bucketStart)*float64(rank/count),即0.4 + 0.2*(2/2) = 0.6和真实值0.5相差不大,在样本量更大的情况下,将更加精确。 - Prometheus 提供了相关的函数
histogram_quantile。
- 按照 le 标签排序,查找第一个满足
Summary
用来在客户端直接计算出某个值(通常是请求持续时间或响应大小等)的分位数,然后直接上报到 Prometheus。
通过 Observe() 函数,Summary 会上报如下三个时序指标:
<basename>{quantile="<φ>"}某个分位数的值。<basename>_sum和 Histogram 的一致,为 值的总和。<basename>_count为Observe()函数调用的次数。
因此,通过 Summary 可以计算出:
- QPS:
rate(<basename>_count) - 平均值:
rate(<basename>_sum[1m]) / rate(<basename>_count[1m])。 - 分位数:
<basename>{quantile="<φ>"}
Histogram vs Summary
- Histogram
- 客户端性能消耗小,服务端查询分位数时消耗大。
- 可以在查询期间自由计算各种不同的分位数。
- 分位数的精度无法保证,其精确度受桶的配置、数据分布、数据量大小情况影响。
- 可聚合,可以计算全局分位数。
- 客户端兼容性好。
- Summary
- 客户端性能消耗大(因为分位数计算发生在客户端),服务端查询分位数时消耗小。
- 只能查询客户端上报的哪些分位数。
- 分位数的精度可以得到保证,精度会影响客户端的消耗。
- 不可聚合,无法计算全局分位数(因此不支持多实例,平行扩展的 http 服务)。
- 客户端兼容性不好。
综上所述,大多数场景使用 Histogram 更为灵活。
客户端库的使用
以 Go 为例,展示上面所有数据类型的上报。
Go Client 概述
模块 github.com/prometheus/client_golang 包含如下内容(详见:go doc):
- prometheus 包,实现了 Metrics 的核心接口:
- 四种 Metrics 类型:Counter、Gauge、Histogram、Summary,以及对应的 Vec。
- Registry、Registerer、Gatherer 接口,用来管理注册的指标。
- prometheus/collectors 包,实现了 Go 进程和 Go Runtime 相关的指标定义和收集。
- prometheus/graphite 包,提供了将 Prometheus 指标推送到 Graphite 服务器的能力。
- prometheus/promauto 包,提供了一种创建四种 Metrics 类型的可读性更好的 API 风格。
- prometheus/promhttp 包,提供围绕 HTTP 服务器和客户端的工具。
- 定义和实现了一系列针对 http server / client 的指标,并通过包装函数(Middleware)方式提供。
- 实现了暴露 metrics 的断点,以供 Prometheus Server Pull 采集。
- prometheus/push 包,提供了将指标推送到 push gateway 的能力。
示例
监控 HTTP Server
实现一个 HTTP Server 的 Middleware 可以上报每个请求的监控数据。
02-prometheus/metrics.go
package main

// 本例仅用来展示 Prometheus Go SDK 的用法,不可用于生产。
// 1. http middleware 可以直接使用 github.com/prometheus/client_golang/prometheus/promhttp 包。
// 2. go runtime 可以直接使用 github.com/prometheus/client_golang/prometheus/collectors 包。

import (
	"fmt"
	"net/http"
	"os"
	"runtime"
	"time"

	"github.com/prometheus/client_golang/prometheus"
	"github.com/prometheus/client_golang/prometheus/promhttp"
)

type HTTPMetricsMiddleware struct {
	reg                    *prometheus.Registry
	httpRequestsTotal      *prometheus.CounterVec
	goMemstatsAllocBytes   prometheus.Gauge
	httpDurations          *prometheus.SummaryVec
	httpDurationsHistogram *prometheus.HistogramVec
}

func NewHTTPMetrics(reg *prometheus.Registry, normMean, normDomain float64) *HTTPMetricsMiddleware {
	// 一些进程粒度的标签,比如 pod name 之类的,这里使用 pid 模拟。
	ConstLabels := map[string]string{
		"pid": fmt.Sprint(os.Getpid()),
	}
	httpLabelNames := []string{"handler", "method", "status_code"}
	m := &HTTPMetricsMiddleware{
		reg: reg,
		// 创建一个 Counter 类型的指标:每个请求会增加 1。
		// 下文, SummaryVec 或者 httpDurationsHistogram 会自动上报该指标,这里仅做演示。
		httpRequestsTotal: prometheus.NewCounterVec(
			prometheus.CounterOpts{
				Name:        "http_requests_total",
				Help:        "HTTP request total.",
				ConstLabels: ConstLabels,
			},
			httpLabelNames,
		),
		// 创建一个 Gauge 类型的指标:统计当前时刻的 go runtime memstats alloc。
		// 下文, SummaryVec 或者 httpDurationsHistogram 会自动上报该指标,这里仅做演示。
		goMemstatsAllocBytes: prometheus.NewGauge(prometheus.GaugeOpts{
			Name:        "go_memstats_alloc_bytes",
			Help:        "HTTP request total.",
			ConstLabels: ConstLabels,
		}),
		// 创建一个 SummaryVec 类型的指标:按照 handler 标签,计算请求耗时的 50% 90% 99% 分位数。
		httpDurations: prometheus.NewSummaryVec(
			prometheus.SummaryOpts{
				Name:        "http_durations_seconds",
				Help:        "HTTP latency distributions.",
				Objectives:  map[float64]float64{0.5: 0.05, 0.9: 0.01, 0.99: 0.001},
				ConstLabels: ConstLabels,
			},
			httpLabelNames,
		),
		// 和上面的 httpDurations 类似,但是类型为 Histogram
		// Histogram 分为 20 个桶,桶的划分为:
		//   * 区间 [normMean-5*normDomain, normMean+0.5*normDomain]
		//   * 步长为 0.5*normDomain
		// 举个例子,当 normMean = 1, normDomain = 0.2 时,桶划分为: {0, 0.1, 0.2, ..., 1, ..., 1.8, 1.9}
		httpDurationsHistogram: prometheus.NewHistogramVec(
			prometheus.HistogramOpts{
				Name:                        "http_durations_histogram_seconds",
				Help:                        "HTTP latency distributions.",
				Buckets:                     prometheus.LinearBuckets(normMean-5*normDomain, .5*normDomain, 20),
				NativeHistogramBucketFactor: 1.1,
				ConstLabels:                 ConstLabels,
			},
			httpLabelNames,
		),
	}
	reg.MustRegister(m.httpRequestsTotal)
	reg.MustRegister(m.goMemstatsAllocBytes)
	reg.MustRegister(m.httpDurations)
	reg.MustRegister(m.httpDurationsHistogram)
	return m
}

func (m *HTTPMetricsMiddleware) MetricsHandler() http.Handler {
	return promhttp.HandlerFor(m.reg, promhttp.HandlerOpts{
		// Opt into OpenMetrics to support exemplars.
		EnableOpenMetrics: true,
		// Pass custom registry
		Registry: m.reg,
	})
}

func (m *HTTPMetricsMiddleware) WrapHandler(handlerName string, handler http.HandlerFunc) http.HandlerFunc {
	return http.HandlerFunc(func(w http.ResponseWriter, r *http.Request) {
		startTime := time.Now()
		ww := &metricsHTTPResponseWrapper{
			ResponseWriter: w,
			statusCode:     0,
		}
		handler.ServeHTTP(ww, r)
		duration := float64(time.Since(startTime)) / float64(time.Second)
		statusCode := fmt.Sprint(ww.statusCode)
		m.httpRequestsTotal.WithLabelValues(handlerName, r.Method, statusCode).Add(1)
		m.httpDurations.WithLabelValues(handlerName, r.Method, statusCode).Observe(duration)
		m.httpDurationsHistogram.WithLabelValues(handlerName, r.Method, statusCode).Observe(duration)
	})
}

func (m *HTTPMetricsMiddleware) StartBackgroundReportGoCollector(interval time.Duration) {
	// 这只是例子,想要统计 go runtime 相关的指标,可以直接使用 go collector,参见:https://github.com/prometheus/client_golang/blob/main/examples/gocollector/main.go
	// https://gist.github.com/j33ty/79e8b736141be19687f565ea4c6f4226
	go func() {
		for {
			var stat runtime.MemStats
			runtime.ReadMemStats(&stat)
			m.goMemstatsAllocBytes.Set(float64(stat.Alloc))
			time.Sleep(interval)
		}
	}()
}

type metricsHTTPResponseWrapper struct {
	http.ResponseWriter
	statusCode int
}

func (w *metricsHTTPResponseWrapper) WriteHeader(statusCode int) {
	w.statusCode = statusCode
	w.ResponseWriter.WriteHeader(statusCode)
}
02-prometheus/server.go
package main

import (
	"fmt"
	"math/rand"
	"net/http"
	"time"

	"github.com/prometheus/client_golang/prometheus"
)

func handler1(w http.ResponseWriter, req *http.Request) {
	fmt.Println("handler1 handling")
	time.Sleep(time.Duration(rand.Float64() * float64(time.Second)))
	statusCodes := []int{200, 400, 500}
	statusCode := 0
	r := rand.Intn(100)
	if r < 91 {
		statusCode = statusCodes[0]
	} else if r < 97 {
		statusCode = statusCodes[1]
	} else {
		statusCode = statusCodes[2]
	}
	w.WriteHeader(statusCode)
}

func handler2(w http.ResponseWriter, req *http.Request) {
	fmt.Println("handler2 handling")
	time.Sleep(time.Duration(rand.Float64() * float64(time.Second)))
	statusCodes := []int{200, 400, 500}
	statusCode := 0
	r := rand.Intn(100)
	if r < 93 {
		statusCode = statusCodes[0]
	} else if r < 95 {
		statusCode = statusCodes[1]
	} else {
		statusCode = statusCodes[2]
	}
	w.WriteHeader(statusCode)
}

func Run() {
	reg := prometheus.NewRegistry()
	metrics := NewHTTPMetrics(reg, 1, 0.2)
	metrics.StartBackgroundReportGoCollector(10 * time.Second)
	http.HandleFunc("/handler1", metrics.WrapHandler("/handler1", handler1))
	http.HandleFunc("/handler2", metrics.WrapHandler("/handler2", handler2))
	http.HandleFunc("/metrics", metrics.MetricsHandler().ServeHTTP)

	http.ListenAndServe(":8083", nil)
}

func main() {
	Run()
}
编写模拟请求的客户端
02-prometheus/server_test.go
package main

import (
	"math/rand"
	"net/http"
	"testing"
	"time"
)

func RequestHandler(handlerName string) {
	resp, err := http.Get("http://localhost:8083" + handlerName)
	if err != nil {
		panic(err)
	}
	defer resp.Body.Close()
}

func TestRun(t *testing.T) {
	go Run()
	handlerNameChan := make(chan string)
	go func() {
		for {
			if rand.Float64() < 0.6 {
				handlerNameChan <- "/handler1"
			} else {
				handlerNameChan <- "/handler2"
			}
		}
	}()
	for i := 0; i < 100; i++ { // 并发度
		go func() {
			for {
				RequestHandler(<-handlerNameChan)
			}
		}()
	}
	time.Sleep(130 * time.Second)
}
配置 Prometheus Server
02-prometheus/prometheus.yml
# ~/Downloads/prometheus-2.37.2.darwin-amd64/prometheus --config.file=02-prometheus/prometheus.yml --storage.tsdb.path="prometheus-tsdb-data/"
global:
  scrape_interval: 15s
  evaluation_interval: 15s

scrape_configs:
  - job_name: "demo"
    # metrics_path: # 默认是 '/metrics'
    static_configs:
      - targets: ["localhost:8083"]
启动测试
# 第一个终端
~/Downloads/prometheus-2.37.2.darwin-amd64/prometheus --config.file=02-prometheus/prometheus.yml --storage.tsdb.path="prometheus-tsdb-data/"

# 第二个终端
cd 02-prometheus && go test -timeout 600s -run ^TestRun$ ./ -v --count=1
等待第二个终端运行结束,打开 http://localhost:9090/graph,切换到 Graph 标签,输入如下表达式查看绘图:
rate(http_requests_total[30s])请求 qps。go_memstats_alloc_bytes当前进程分配的内存。http_durations_seconds{quantile='0.9'}请求耗时 90% 分位数,应该在 0.9 附近。rate(http_durations_seconds_count[30s])请求 qps,和第 1 个结果完全一致。rate(http_durations_seconds_sum[30s]) / rate(http_durations_seconds_count[30s])请求平均耗时,应在在 0.5 附近。histogram_quantile(0.9, rate(http_durations_histogram_seconds_bucket[30s]))请求耗时 90% 分位数,应该在 0.9 附近。rate(http_durations_histogram_seconds_count[30s])请求 qps,和第 1 个结果完全一致。rate(http_durations_histogram_seconds_sum[30s]) / rate(http_durations_histogram_seconds_count[30s])请求平均耗时,应在在 0.5 附近。
通过 Push Gateway 上报
安装运行 Push Gateway
下载并运行 Push Gateway(下载页面|源码页面)。
tar xvfz pushgateway-*.tar.gz
cd pushgateway-*/
./pushgateway --help  # Mac 需要打开系统偏好设置 -> 安全性和隐私,允许改程序运行。
./pushgateway
打开
http://localhost:9091可以查看 pushgateway 的工作情况。
示例代码改造
02-prometheus/metrics.go
// ...

import (
	// ...
	"github.com/prometheus/client_golang/prometheus/push"
)

// ...

func (m *HTTPMetricsMiddleware) StartMetricsPush(interval time.Duration) {
	go func() {
		for {
			_ = push.New("http://localhost:9091/metrics", "demo_by_pushgateway").Gatherer(m.reg).Push()
			time.Sleep(interval)
		}
	}()
}
// ...
02-prometheus/server.go
// ...
func Run() {
	// ...
	metrics.StartBackgroundReportGoCollector(10 * time.Second)
	metrics.StartMetricsPush(10 * time.Second)
	http.HandleFunc("/handler1", metrics.WrapHandler("/handler1", handler1))
	// ...
}
// ...
配置 Prometheus Server
02-prometheus/prometheus-pushgateway.yml
# ~/Downloads/prometheus-2.37.2.darwin-amd64/prometheus --config.file=02-prometheus/prometheus-pushgateway.yml --storage.tsdb.path="prometheus-tsdb-data/"
global:
  scrape_interval: 15s
  evaluation_interval: 15s

scrape_configs:
  - job_name: "pushgateway"
    # metrics_path: # 默认是 '/metrics'
    honor_labels: true  # 不覆盖 metrics 自身的 job 和 instance 标签,参见: https://prometheus.io/docs/prometheus/latest/configuration/configuration/#scrape_config
    static_configs:
      - targets: ["localhost:9091"]
启动测试 (Push)
# 第一个终端
rm -rf prometheus-tsdb-data/ && ~/Downloads/prometheus-2.37.2.darwin-amd64/prometheus --config.file=02-prometheus/prometheus-pushgateway.yml --storage.tsdb.path="prometheus-tsdb-data/"

# 第二个终端
cd 02-prometheus && go test -timeout 600s -run ^TestRun$ ./ -v --count=1
打开 http://localhost:9091 观察 pushgateway 是否收到消息
等待第二个终端运行结束,打开 http://localhost:9090/graph,切换到 Graph 标签,输入类似上文 示例-启动测试,如 rate(http_requests_total[30s]),即可看到从 Pushgateway 采集到的来自示例代码 push 上来的指标。
数据查询 PromQL
Prometheus 自定义了一种表达式查询语言,被称为 PromQL。真正的查询实例还需要提供如下参数:
- 开始时间
- 结束时间
- 查询解析度 (step / query resolution)
Prometheus 会根据这些 PromQL、开始时间、结束时间、查询解析度,生成评估时间序列。然后到时序数据库中查询、过滤、聚合数据。
表达式数据类型
PromQL 表达式的结果有如下四种类型:
- Instant vector,一组时间序列,每个时间序列包含一个样本,所有样本共享相同的时间戳,如。
- Range vector, 一组时间序列,其中包含每个时间序列随时间变化的一系列数据点
- Scalar, 一个简单的数字浮点值。
- String,一个简单的字符串值;目前未使用。
举个例子假设一个 Counter 类型的指标 http_requests_total 的采样间隔是 15s。此时:
http_requests_total这个表达式就是一个 Instant vector ,一个示例为:时间 值 2022-11-18 18:00:15 1 2022-11-18 18:00:30 3 2022-11-18 18:00:45 9 2022-11-18 18:01:00 20
http_requests_total[30s]这个表达式就是一个 Range vector,一个示例为:时间范围 值 2022-11-18 18:00:15 ~ 2022-11-18 18:00:30 [1, 3] 2022-11-18 18:00:45 ~ 2022-11-18 18:01:00 [9, 20]
字面量和注释
字符串,使用单引号双引号以及反引号包裹,采用 Go 语言转义规则。
"this is a string"
'these are unescaped: \n \\ \t'
`these are not unescaped: \n ' " \t`
浮点数字面量。
23
-2.43
3.4e-9
0x8f
-Inf
NaN
注释,以
#号开头。# This is a comment
时间序列选择
在编写 PromQL 时,首先需要的是选择一个待查询的时间序列(Instant vector 或 Range vector),然后才能使用运算符和函数对这些数据进行处理,以得到最终想要的图表或者报警数据源。
Instant vector
http_requests_total选择所有名为http_requests_total的时间序列http_requests_total{job="prometheus",group="canary"}选择所有名为http_requests_total且 label 的job="prometheus",group="canary"的时间序列。通过{k1="v1"[...,kn="vn"]}的方式可以过滤符合指定条件标签的时间序列。除了=,还支持如下匹配符:=严格等于。!=不等于。=~匹配正则表达式(env=~"foo"等价于env=~"^foo$")。!~不匹配正则表达式。
一些例子如下:
http_requests_total{environment=~"staging|testing|development",method!="GET"}。http_requests_total等价于{__name__="http_requests_total"}。
Range Vector
在 Instant vector 表达式的后方,添加 [$TimeDuration] 即可创建 Range Vector,如: http_requests_total{job="prometheus"}[5m]。time duration 为 go time duration 格式:
ms- 毫秒s- 秒m- 分钟h- 小时hoursd- 天 = 24hw- 周 = 7dy- 年 = 365d
也支持组合,如:
5h
1h30m
5m
10s
进行时间相对偏移
offset $TimeDuration 对评估时间进行偏移,假设对表达式 http_requests_total offset 5m 的查询开始时间为 11:00, 结束时间为 11:05,采样周期为 1m,此时:
- 评估时间 11:01,查询到的为 11:01 - 5m 即 10:56 的数据。
- 评估时间 11:02,查询到的为 11:02 - 5m 即 10:57 的数据。
- 评估时间 11:03,查询到的为 11:03 - 5m 即 10:58 的数据。
- 评估时间 11:04,查询到的为 11:04 - 5m 即 10:59 的数据。
- 评估时间 11:05,查询到的为 11:05 - 5m 即 11:00 的数据。
在图表上来看相当于修改时间序列的时间戳,即坐标系不变,图形向右移动。
一些例子如下:
http_requests_total offset 5m评估时间 5 分钟前的时间序列。rate(http_requests_total[5m] offset 1w)评估时间 1 周前的 http_requests_total 的 5 分钟 rate。rate(http_requests_total[5m] offset -1w)评估时间 1 周后的 http_requests_total 的 5 分钟 rate。
修改为绝对时间
@ $UnixTimestamp (UnixTimestamp 为秒时间戳) 修改 Instant vector 和 Range Vector 单个查询的评估时间为固定值,假设对表达式 http_requests_total @ 1668909600 (2022-11-20T10:00:00+08)的查询开始时间为 11:00, 结束时间为 11:05,采样周期为 1m,此时:
- 评估时间 11:01,查询到的为固定值 1668909600 即 10:00 的数据。
- 评估时间 11:02,查询到的为固定值 1668909600 即 10:00 的数据。
- 评估时间 11:03,查询到的为固定值 1668909600 即 10:00 的数据。
- 评估时间 11:04,查询到的为固定值 1668909600 即 10:00 的数据。
- 评估时间 11:05,查询到的为固定值 1668909600 即 10:00 的数据。
在图表上来看,指标变为一条水平的直线。
一些例子如下:
http_requests_total @ 1609746000始终查询时间戳为 1609746000 的数据。sum(http_requests_total{method="GET"} @ 1609746000)http_requests_total offset 5m @ 1609746000支持和 offset 一起使用。http_requests_total @ 1609746000 offset 5m支持和 offset 一起使用,@和offest的顺序不重要。start()和end()可以作为 @ 的特殊值。http_requests_total @ start() rate(http_requests_total[5m] @ end())
运算符和函数
算数运算符
+加-减*乘/除%求余 (modulo)^次幂atan2参见 https://pkg.go.dev/math#Atan2 。
算数运算符的数据类型。
- 两个 scalar 之间:类型直接运算。
- scalar 和 instant vector 之间:用 scalar 和 instant vector 的每个值进行运算。
- 两个 instant vectors:参见下文的 向量匹配。
比较运算符
==相等!=不等于>大于<小于>=大于等于<=小于等于。
算数运算符的数据类型。
- 两个 scalar 之间:如
1 > bool 0(1 > 0将报错),返回 1 (true)。 - scalar 和 instant vector 之间:根据是否添加
bool标识符分为如下两种情况:http_requests_total > 100保留向量值大于 100 的值,丢弃其他值。http_requests_total > bool 100将向量值大于 100 的值变为 1 (true),将小于 100 的值变为 0 (false),且指标名将被删除。
- 两个 instant vector 之间:按照下文的 向量匹配 进行匹配。
- 如果不添加
bool标识符,则结果为过滤后,表达式成立的左侧的值。不满足条件(表达式非法、没有匹配上、表达式结果为 false)的将被丢弃。 - 如果添加
bool标识符,向量的值将变为 1 或 0。1 表示表达式结果为 true, 0 表示表达式非法、没有匹配上、表达式结果为 false。
- 如果不添加
集合运算符
集合运算符只能在两个 instant vector (vector1、vector2)进行运算。vector1 的元素在 vector2 是否存在的判断是根据向量的标签进行查找判断的。
可以这么理解,假设 vector1 和 vector2 做集合运算,按照标签可以将两者的所有元素划分为如下四种类型:
left(vector1)middle(vector1)middle(vector2)right(vector2)
此时,如下三种集合运算:
and(交集) ,vector1 and vector2结果为: vector1 对应的标签在 vector2 也存在的 vector1 值的集合,即middle(vector1)。or(union),vector1 or vector2结果为: vector1 全部的元素 以及 vector2 中标签在 vector1 中不存在的元素,即left(vector1)、middle(vector1)和right(vector2)。unless(补集),vector1 and vector2结果为: vector1 对应的标签在 vector2 不存在存在的 vector1 值的集合,即left(vector1)。
向量匹配
以如下数据为例:
method_code:http_errors:rate5m{method="get", code="500"}  24
method_code:http_errors:rate5m{method="get", code="404"}  30
method_code:http_errors:rate5m{method="put", code="501"}  3
method_code:http_errors:rate5m{method="post", code="500"} 6
method_code:http_errors:rate5m{method="post", code="404"} 21

method:http_requests:rate5m{method="get"}  600
method:http_requests:rate5m{method="del"}  34
method:http_requests:rate5m{method="post"} 120
向量匹配的原则是,按照标签进行匹配,如果用于匹配的标签只有一方存在,那么这个标签对应的数据将被丢弃。
如上所示,两个指标进行向量匹配时,其对应的标签可能并不一样。为了让标签可以对应的上,在进行运算符操作时,可以使用 ignore 或者 on 来选择用于匹配的标签。
- ignore 表示忽略掉指定的标签,而保留其他标签。
on 表示只使用指定的标签,忽略掉未声明的标签。
<vector expr> <bin-op> ignoring(<label list>) <vector expr>
<vector expr> <bin-op> on(<label list>) <vector expr>
使用 ignore 或者 on 可能会带来一个问题,即同一个待匹配的标签存在多个值的情况,可以分如下情况讨论。
一对一。以
method_code:http_errors:rate5m{code="500"} / ignoring(code) method:http_requests:rate5m为例,因为{code="500"}和ignoring(code)成对出现,因此左侧的向量仍然是一个标签对应一个值。所以左右按照标签进行对应即可。因此结果如下:// left ({code="500"} / ignoring(code)) method_code:http_errors:rate5m{method="get"/*, code="500" */} 24 method_code:http_errors:rate5m{method="post"/*, code="500"*/} 6 // right method:http_requests:rate5m{method="get"} 600 method:http_requests:rate5m{method="post"} 120 {method="get"} 0.04 // 24 / 600 {method="post"} 0.05 // 6 / 120多对一以及一对多。需使用
group_left或group_right来约束,左右哪一方是 多 的一方。以method_code:http_errors:rate5m / ignoring(code) group_left method:http_requests:rate5m为例,结果为:// left (/ ignore code group_left,匹配时,只是用 method 进行匹配) method_code:http_errors:rate5m{method="get"/*, code="500"/*} 24 method_code:http_errors:rate5m{method="get"/*, code="404"/*} 30 method_code:http_errors:rate5m{method="post"/*, code="500"/*} 6 method_code:http_errors:rate5m{method="post"/*, code="404"*/} 21 // right method:http_requests:rate5m{method="get"} 600 method:http_requests:rate5m{method="post"} 120 {method="get", code="500"} 0.04 // 24 / 600 {method="get", code="404"} 0.05 // 30 / 600 {method="post", code="500"} 0.05 // 6 / 120 {method="post", code="404"} 0.175 // 21 / 120多对多,不支持。
聚合操作
对某个时刻的值,进行聚合。换句话来说,是减少标签的数目。支持的函数如下:
sum(在指定维度上求和)max(在指定维度上求最大值)min(在指定维度上求最小值)avg(在指定维度上求平均值)group(all values in the resulting vector are 1)stddev(在指定维度上求标准差)stdvar(在指定维度上求方差)count(统计向量元素的个数)count_values(统计具有相同数值的元素数量)bottomk(样本值中最小的 k个值)topk(样本值中最大的 k个值)quantile(在指定维度上统计 φ-quantile 分位数(0 ≤ φ ≤ 1))
语法如下:
<aggr-op> [without|by (<label list>)] ([parameter,] <vector expression>)
// or
<aggr-op>([parameter,] <vector expression>) [without|by (<label list>)]
假设 http_requests_total 只有三个标签:instance, application, group 。一些例子如下:
sum without (instance) (http_requests_total)等价于sum by (application, group) (http_requests_total)去除 instance 标签维度,计算请求量。sum(http_requests_total)不需要区分标签,计算全局请求量。topk(5, sum by (instance) (http_requests_total))计算获取到请求量前 5 的实例。
二元运算符优先级
从高到底分别是:
^*,/,%,atan2+,-==,!=,<=,<,>=,>and,unlessor
相同优先级的运算符是左结合的。例如,2 3 % 2 等价于 (2 3) % 2。但是 ^ 是右结合的,所以 2 ^ 3 ^ 2 等价于 2 ^ (3 ^ 2)。
函数
参见:FUNCTIONS。
这里重点提一下:
rate(v range-vector)上文多次提到该函数,其计算的时指标的每秒变化率。如rate(http_requests_total[5m]),计算结果为(value[t+5m] - value[t])/ 300。- 针对 Range vector PromQL 提供
<aggregation>_over_time()一系列聚合函数,可以将Range vector转换为Instant vector。
与 SQL 对比
PromQL 处理的是时序数据,而 SQL 处理的通用的关系数据。本质上可以说 PromQL 是 SQL 的一个特例,因此 SQL 应该是可以完整的表达 PromQL 的语义的。
| PromQL | SQL |
|---|---|
| metric name | 表名 |
| label | 列 (维度列) |
| 时间戳 | 列 (创建时间) |
| value | 列 (事实列) |
| 一次查询条件 $StartTime、$EndTime | select 创建时间 as 评估时间, value where 创建时间 between $StartTime and $EndTime |
http_requests_total | from 表名 |
{} | where 维度列条件 |
offset | select 创建时间 + offset as 评估时间 where 创建时间 + offset between $StartTime and $EndTime |
@ | 可能需要用到开窗函数 first_value,略 |
| 算数运算符 (scalar 和 scalar) | select 1 + 1 或 select 1 + (select ...) |
| 算数运算符 (scalar 和 instant vector) | select 2 * value from ... |
| 算数运算符 (instant 和 instant vector) | select value1 * value2 from ... <inner/left/right> join ... on 事实列 where value1 is not null and value2 is not null |
| 比较运算符 (不带 bool) | select value from ... where value < 1 或 select value1 from ... <inner/left/right> join ... on 维度列 where value1 is not null and value2 is not null and value1 < value2 |
| 比较运算符 (带 bool) | select if(value < 1, 1, 0) from ... 或 select if(value1 < value2, 1, 0) from ... <inner/left/right> join ... on 维度列 where value1 is not null and value2 is not null |
| 集合运算符 (and) | select value1 from ... inner join ... on 维度列 |
| 集合运算符 (or) | select if(value1 is not nul, value1, value2) from ... full join ... on 维度列 |
| 集合运算符 (unless) | select if(value1 is not nul, value1, value2) from ... left join ... on 维度列 where value2 is null |
| 聚合操作 | select 指定维度列, 聚合函数(value) from ... group by 指定维度列) |
| 接收 Range vector 的函数操作 | select 所有维度列, 创建时间戳 - 创建时间戳%5m, 聚合函数(value) from ... group by 所有维度列, 创建时间戳 - 创建时间戳%5m |
数据大盘 Grafana
参考:官方文档
报警接入
参考:官方文档
Exporter
参考:官方文档。
Node Exporter
参考:官方文档
MySQL Exporter
参见:github。
Redis exporter
参见:github。
RocketMQ exporter
参见:github。
实现一个 Exporter
参考:官方文档
最佳实践
参考:官方文档